
[Photo by Marty McGuire on Unsplash]
What creepy risks move during the night ...
Information never stops. Not even after closing hours. And particularly not in financial markets. But how different is the behavior of these markets when they are open and trading takes place, compared to when they are closed.
In our paper entitled "Observation-driven Models for Realized Variances and Overnight Returns", Anne Opschoor and myself study the behavior of overnight versus intraday stock price movements. Using new dynamic models, we find that the proportion of stock return risk born during the day versus during the night varies over time. Apparently, not all nights are equally quiet. In particular, we find that when financial markets are unsettled for financial stocks, more information and risk is impounded in prices during closing hours. In short, when daytime trading is already strenuous and risky, traders cannot look forward to a quiet night of sleeping: the nights will even have a relatively riskier character than usual. Extra care thus seems warranted for running overnight risk and tighter limits on end-of-day risk books might have to be imposed.
Download the paper:
Opschoor, Anne, Andre Lucas (2019): "Observation-driven Models for Realized Variances and Overnight Returns", Tinbergen Institute Discussion Paper 19-052/IV.
Some believe that extreme good luck (or bad luck) is a fact of life. A hot streak in football, baseball or soccer would be a good example. Sometimes you are on a hot streak ... sometimes you are not.
The extreme outcomes caused by such streaks have their analogue in financial markets: you could face an extreme positive or negative return. Does the probability of such extreme outcomes vary over time. In other words: could there be streaks of negative returns (and thus a large negative compounded extreme negative return) at some times, but not at others.
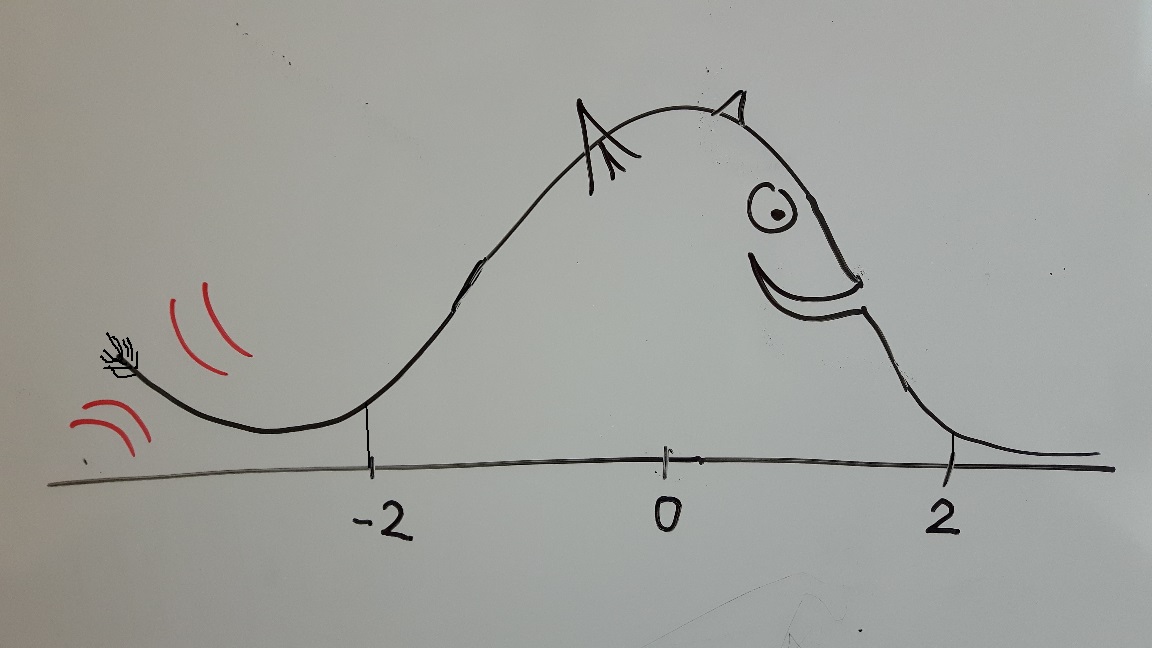
In our paper entitled "Time-varying tail behavior for realized kernels", Anne Opschoor and myself look into the time variation of extreme financial stock returns. We go beyond many of the standard literature in that we do not only make risk time-varying, but also extreme risk. Technically, this means we allow the tail behavior of a distrubution to move over time, not unlike a dog wagging its tail up and down. Using our new machinery, we find evidence that indeed extreme outcomes are more likely during some times than others, as our model beats a number of modern benchmarks in a forecasting contest.
The upshot of all of this is that extra risk controls may be in order in situations where not only standard risks are high, but extreme risk probabilities are high as well.
Download the paper:
Opschoor, Anne, Andre Lucas (2019): "Time-varying tail behavior for realized kernels", Tinbergen Institute Discussion Paper 19-051/IV.

Suppose I show you a picture of a monkey. Of course, if the picture is a coarse sketch, you get the rough idea, but miss many of the details. If I show you a photo instead, you get all the details and corresponding wonder.
Taking a picture (at least for me) is much easier than making a sketch. However, when modeling many stock prices simultaneously, constructing a fully detailed picture is hard, particularly if we want to show how risk properties of stocks (or other assets) move together over time. When does the dependence between different parts of the market cluster together, and what risk build-up does this entail? Because of the complexity of this dynamic modeling problem, researchers so far have regularly resorted to simple, coarse models: so-called single-factor dynamic copula models with time-varying loadings (sorry for the bit of jargon here). The gist of it: with a coarse model, we get at a least the main movements right, we hope.
In our paper entitled "Closed-Form Multi-Factor Copula Models with Observation-Driven Dynamic Factor Loadings", Anne Opschoor, Istvan Barra, Dick van Dijk and myself show that to model the full dependence dynamics in large markets with many assets, a photo rather than a sketch is useful and required. In particular, we not only need to model the broad market movements, but also the intra-industry risk dynamics and their cross-industry spill-overs to get a good impression of all aspects of risk.
The new model we provide is computationally tractable, even with many factors. It is quick to compute (due to the use of our favorite score dynamics), and scalable to high dimensions. Computational complexity thus no longer seems a reason to stick to a simple model. Using US stock market data we illustrate that our model works well in-sample and out-of-sample if we consider all aspects of risk (i.e., the entire outcome distribution). If instead we concentrate on a specific single aspect of risk, namely the riskiness of the investment portfolio with minimum variance, a coarse (one-factor) model can capture this single risk aspect adequately, as expected, but not all other risk aspects at the same time.
The summary of it all is twofold. No: a single factor model with dynamic loadings is insufficient to describe all correlation dynamics in large asset markets. And no: Andre may have some skills in constructing factor models with dynamic loadings, but he is definitely no good at sketching monkeys.
Download the paper:
Opschoor, Anne, Andre Lucas, Istvan Barra, and Dick van Dijk (2019): "Closed-Form Multi-Factor Copula Models with Observation-Driven Dynamic Factor Loadings", Tinbergen Institute Discussion Paper.

During the euro area sovereign debt crisis between 2010 and 2012, severe liquidity squeezes and market malfunctions forced the European Central Bank (ECB) and its 17 national central banks at the time, to act as a lender of last resort to the entire financial system. Large-scale central bank lending to banks ensured the proper functioning of the financial system and, with it, the transmission of monetary policy. In addition, the Eurosystem also acted as an investor-of-last-resort in stressed markets, for example when it purchased government bonds in illiquid secondary markets within its Securities Markets Programme (SMP) between 2010 and 2012.
The Eurosystem's actions as a large-scale lender- and investor-of-last-resort during the euro area sovereign debt crisis had a major impact on the size, composition, and, ultimately, the credit risk of its own balance sheet: could the ECB be taking excessive risks. Particular concern emerged about what would happen if the bonds on the ECB's balance sheet would default, and the effect of this on the central bank's reputation, credibility, independence, and ultimately its ability to steer inflation towards its target of close to but below 2% over the medium term.
Against this background, we asked ourselves the question: Can central bank liquidity provision or asset purchases during a financial crisis reduce risk in net terms? This could happen if risk taking in one part of the balance sheet (e.g., more asset purchases) de-risks other balance sheet positions (e.g., the collateralized lending portfolio) by an equal or even larger amount. How economically important can such risk spillovers be across policy operations? Were the Eurosystem's financial buffers at all times sufficiently high to match its portfolio tail risks? We address these questions by studying monetary policy exposures taken from the Eurosystem's weekly consolidated balance sheet between 2009 and 2015.
Two main findings stand out.
1. lender versus investor of last resort implied credit risks are usually negatively related in our sample. Taking risk in one part of the central bank's balance sheet (e.g., the announcement of asset purchases within the SMP) tended to de-risk other positions (e.g., collateralized lending from previous LTROs). Vice versa, the allotment of two large-scale VLTRO credit operations each decreased the one-year-ahead expected shortfall of the SMP asset portfolio. This implies that in bad times, increasing the ECB's balance sheet size increases risk less than proportionally. Conversely, reducing balance sheet size may not reduce total risk by as much as one would expect by linear scaling. Arguably, the documented risk spillovers call for a measured approach towards reducing balance sheet size after a financial crisis.
2. Some unconventional policy operations did not add risk to the Eurosystem's balance sheet in net terms. For example, we find that the initial OMT announcement de-risked the Eurosystem's balance sheet by 41.4bn euro in 99% expected shortfall (ES). We conclude that, in extreme situations, a central bank can de-risk its balance sheet by doing more, in line with Bagehot's well-known assertion that occasionally ``only the brave plan is the safe plan." Such risk reductions are not guaranteed, however, and counterexamples exist when risk reductions did not occur.
Read the full story in:
Caballero, Diego, Lucas, Andr�, Schwaab, Bernd, Zhang, Xin (2019): "Risk endogeneity at the lender/investor-of-last-resort," ECB Working paper No. 2225. Click here to download.

Why does a child play with a toy car, while most grown-ups fancy a real car instead? Obvious as this may seem, most academics play around with financial models involving a handful of asset prices (or more recently "large" dimensions up to 100), whereas real asset managers have to manage asset portfolios with more than a 1,000 asset prices. Are academics like children, and is it maybe time they grow up and study financial phenomena at the scale that is empirically more relevant?
Like driving a real car is much more challenging than driving a toy car, so is coping with realistically large numbers of assets. In our paper Estimation Risk and Shrinkage in Vast-Dimensional Fundamental Factor Models we study one of the challenges: how to cope with the large number of parameters in models with a large number of assets. In particular, we study a number of recently suggested techniques (called linear and non-linear shrinkage) and their adequacy for solving this challenge. We do so not in the standard academic toy setting, but in a setting of models that are typically used in the financial industry. Such models are called fundamental factor models. We find that such fundamental factor models are already a strong benchmark: academic shrinkage techniques add little to the fundamental factor model performance in the settings we study. In addition, we find for our vast dimensional setting that shrinkage techniques need to be adapted: some of the tuning constants needed to make the techniques work, can no longer be put at their theoretically optimal plug-in values, but need to be readjusted to the new context in order to generate (modest) gains in performance.
Download the paper as Tinbergen Institute working paper version.

Stock prices typically move together. For instance, two stock prices can be affected similarly by common news about the industry they are in, or about the local or global economy. Different methods have been proposed to describe this time variation. A recent method that appears to work well in many settings exploits stock price variations within the day: for instance, every minute, or even more frequent. At such high frequencies, the dependence between stock price movements is typically very persistent: the dependence structure found on one day has quite a long lasting relation to the dependence structure on future days.
In our paper Fractional Integration and Fat Tails for Realized Covariance Kernels, which has been accepted by the Journal of Financial Econometrics, Anne Opschoor and Andre Lucas (me) address the question whether this strong persistence can actually be exploited for longer term forecasting. The short answer is: yes. Even though the information underlying the measurements of dependence is on a minute-by-minute frequency, the resulting measurements can be helpful at horizons as long as up to one month. The tools needed for this have to account for many of the features of stock prices and stock price dependence, such as erratic big price movements (fat tails), changing market nervosity and uncertainty (time-varying volatility), and the strong persistence due to the high-frequency underlying measurements. All of these tool features are needed, but at different periods in time. Whereas accounting for changing market nervosity is always important, correctly accounting for erratic big price movements is particularly relevant during crises, and accounting for strong persistence is important during calmer episodes. Previous methods did not account for all of these features simultaneously in a coherent way.
Download the paper published version in the Journal of Financial Econometrics or see the Tinbergen Institute working paper version.

How to identify the apple, the orange, and the banana if the juggler tosses everything around at high speed. Or differently, how to identify which groups of banks and other financial institutions are alike in a situation where new regulation kicks in fast, fintech companies are rapidly changing the scene, and central banks are implementing non-standard policies and keep interest rates uncommonly low for uncanningly long.
In our paper Bank Business Models at Zero Interest Rates, which has been accepted in the Journal of Business and Economic Statistics, Andre Lucas (me), Julia Schaumburg, and Bernd Schwaab investigate how to come up with groups of peer banks in such a volatile environment. Identifying peer groups is extremely important for regulators to create a level playing field. Similar banks should be charged similar capital buffers to safeguard the financial system and to retain fair competition at the same time.
We devise a new technique inspired by the machine learning literature (clustering) combined with ideas from the financial econometrics literature (score models). Think of it as allowing the moving center of the fruits of the juggler (the apple, orange and banana) being described by one statistical model, and the size of the fruits being determined by another model.
The model is put to work on a sample of 208 European banks, observed over the period 2008-2015, so including the aftermath of the financial crisis and all of the European sovereign debt crisis. Six peer groups of banks are identified. These groups are partly overlapping and partly different from classifications by ECB experts. The findings can thus be used as a complement for policy makers to compare bank profitability, riskiness, and buffer requirements. For example, leverage (as a measure of riskiness) and share of net interest rate income (as a measure of profitability) evolve quite differently for some groups of banks than for others, particularly during the low interest rate environment. A follow-up of this paper is Do negative interest rates make banks less safe?.
Download the papers published version in the Journal of Business and Economic Statistics or see the Tinbergen Institute working paper version or the ECB working paper version.
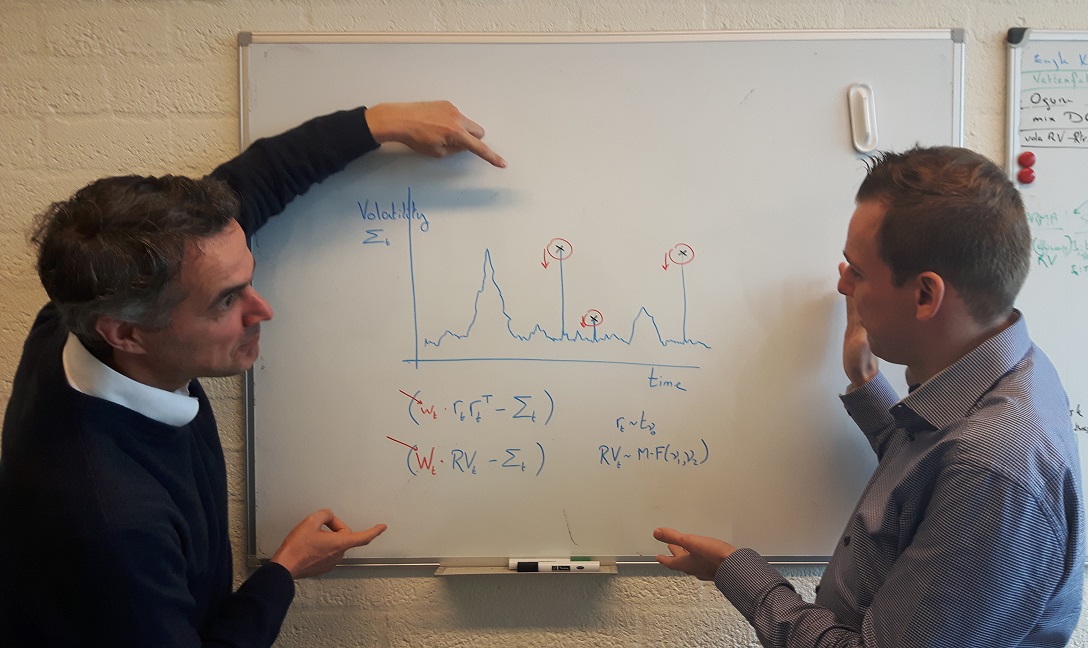
Risk managers, pension funds, asset managers and banks nowadays use advanced models to assess the risk of investment portfolios. Much scientific progress has been made over the past decade to develop new techniques to measure the risk of such portfolios. In recent years scientists and professionals have started to use so-called high-frequency data to measure the risk. High-frequency data are frequent measurements of for instance stock prices or exchange rates. You can think of measurements every minute, every second, or in some cases even every millisecond. Such measurements often result in more accurate risk assessments than traditional daily measurements.
An important issue, however, is how to deal with so-called outliers in high-frequency data. An outlier is an anomalous measurement in the data. Think of a temporary crash in markets due to a faulty algorithm, a typo by a trader, or any other reason. Such anomalous events occur more often than you would think. For instance, in May 2010 there was a famous flash-crash than unsettled the main U.S. financial markets. Within the time span of 36 minutes, the Dow Jones index droped by 9%(!!) and subsequently recovered. Such big swings within the day result in enormous swings in risk measures and incorrect risk forecasts for subsequent days.
Anne Opschoor, Andre Lucas (me), Pawel Janus, and Dick van Dijk have developed a new technique to deal with such anomalous observations in high-frequency data. Our paper New HEAVY Models for Fat-Tailed Realized Covariances and Returns has been accepted in the Journal of Business and Economic Statistics. The core novelty of our approach is that anomalous event do not automatically inflate risk forecasts as in traditional models. Instead, the model trades off whether the increased risk is due to a true increase in risk, or to an incidental, anomalous event. We use statistical techniques calibrated on financial data to properly make this trade-off.
We test the model on a long time series of 30 U.S. stocks over the period 2000-2014. During that period, we have seen big events like the financial crisis of 2008, but also peak events like the May 2010 flash-crash. Using the new techniques, risk forecasts are significantly better than with the most recent competing methods. Moreover, our method is relatively straightforward to implement, which should increase its potential impact.
Download the papers published version in the Journal of Business and Economic Statistics or see the Tinbergen Institute working paper version.

The European Central Bank has implemented a number of unconventional monetary policies
since the financial crisis and the subsequent sovereign debt crisis.
One of the policies involves setting the official rate at which banks can park money at the ECB close to zero, or even below zero.
Was this a wise decision?
The idea of setting the official rate close to or below zero is that banks then have more incentive to *not* put money at the central bank. Rather, it would pay for banks to lend the money out, thus providing more financing to the people and businesses and helping the economy to grow again.
Then again, others argue that low interest rates squeeze the profit opportunities for banks, making them more vulnerable to new economic shocks and risking a new crisis in the financial sector.
In this paper, we investigate how markets percieved the effect of the ECB's decision to impose negative interest rates on the riskiness of banks. In particular, we are interested in whether some bank business models are more prone to the potential negative effects of ECB's policy than others.
We measure riskiness of the banks by well established methodology: the expected amount of capital that has to be injected into a troubled bank in case of an extreme market-wide shock. It is important to consider a situation of extreme market stress, as in that case injecting more capital into a troubled bank is most problematic and hurts most.
We find that policy rate cuts below zero trigger different SRisk responses than an equally-sized cut to zero. There is only weak evidence that large universal banks are affected differently than other banks in the sense that the riskiness of the large banks decreases somewhat more for rate decreases into negative territory.
Download the paper's published version in Economics Letters or see the Tinbergen Institute working paper version.